
Special thanks to Rohde and Schwarz for the RTM3004 featured in this post. Go here to learn more about Rohde & Schwarz Oscilloscopes.
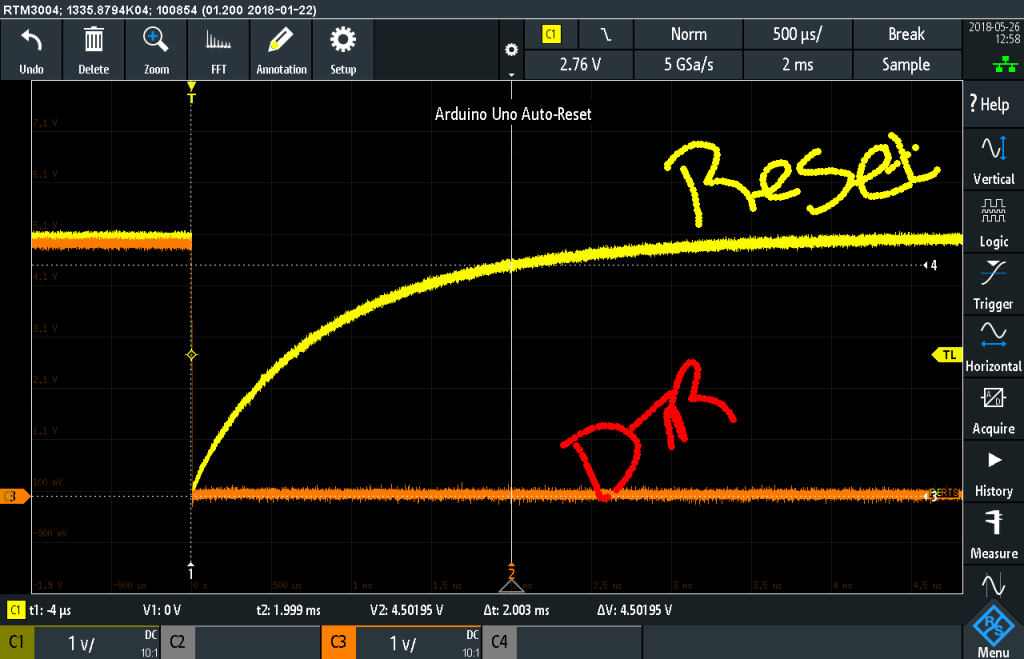
#1 Measure Auto-RESET
This tip applies to Arduino boards with a separate USB-to-Serial chip. Boards such as the Uno, Nano, and Mega2560 have a separate chip. (This measurement does not work with Leondardo, Zero, Teensy, or the boards based on their processors.)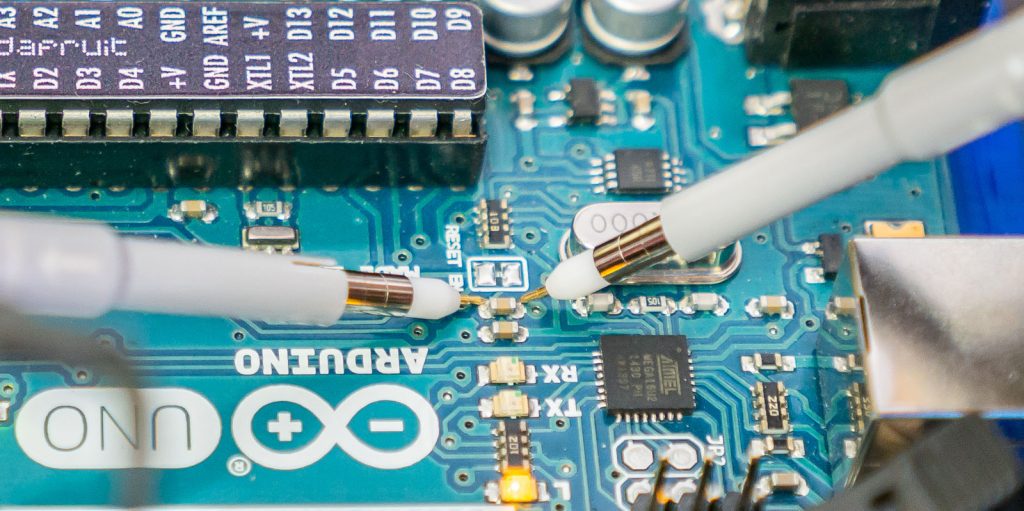
Reader Exercise: Measure Auto RESET
Use your scope’s cursors to measure the auto-reset signal’s length. Bonus points, you need to lookup the logic levels for RESET. They are different from GPIO pins!#2 Capture and Decode TX/RX
Connect a probe to Arduino Uno pin 0. Either use an upside down header pin to clip onto, or, try sticking your probes directly into the hole.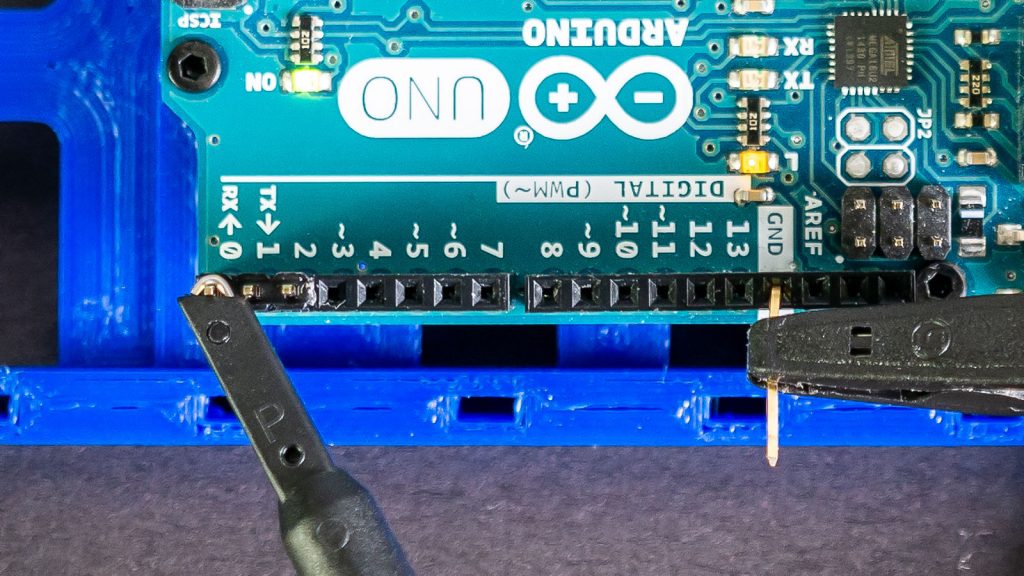
void setup() {
   Serial.begin(9600);
}

void loop() {
   if (Serial.available())
      Serial.write(Serial.read());
   }
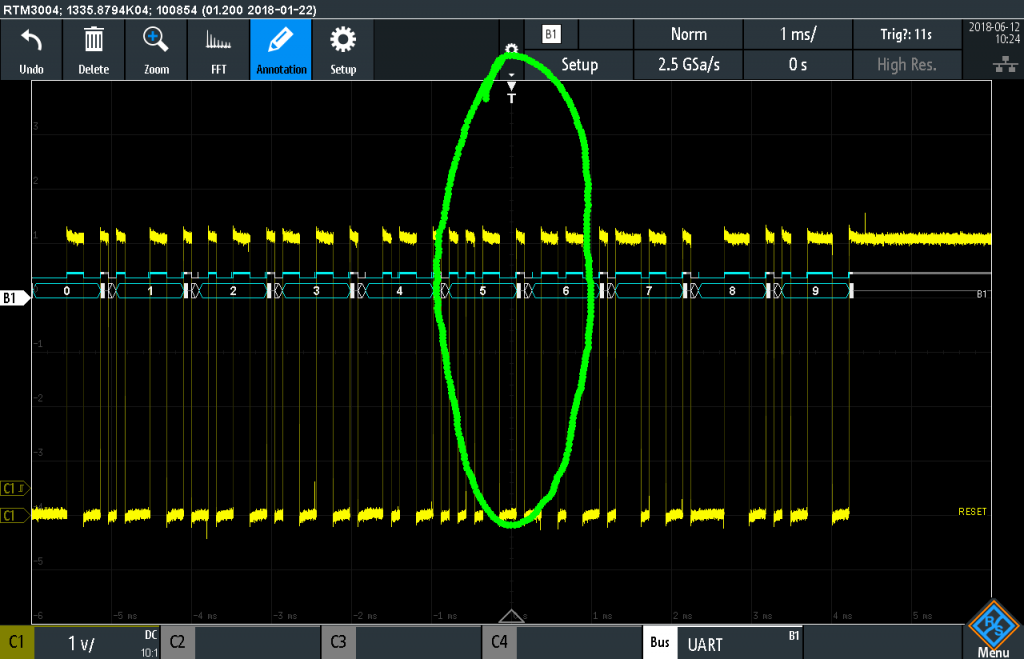
Reader Exercise: UART turn-around-time
Connect probes to both pins 0 and 1 and then load my multiple digits over serial example. Measure how long it takes to capture a sequence and then send it back out.#3 Zoom in on DC Voltage Rail.
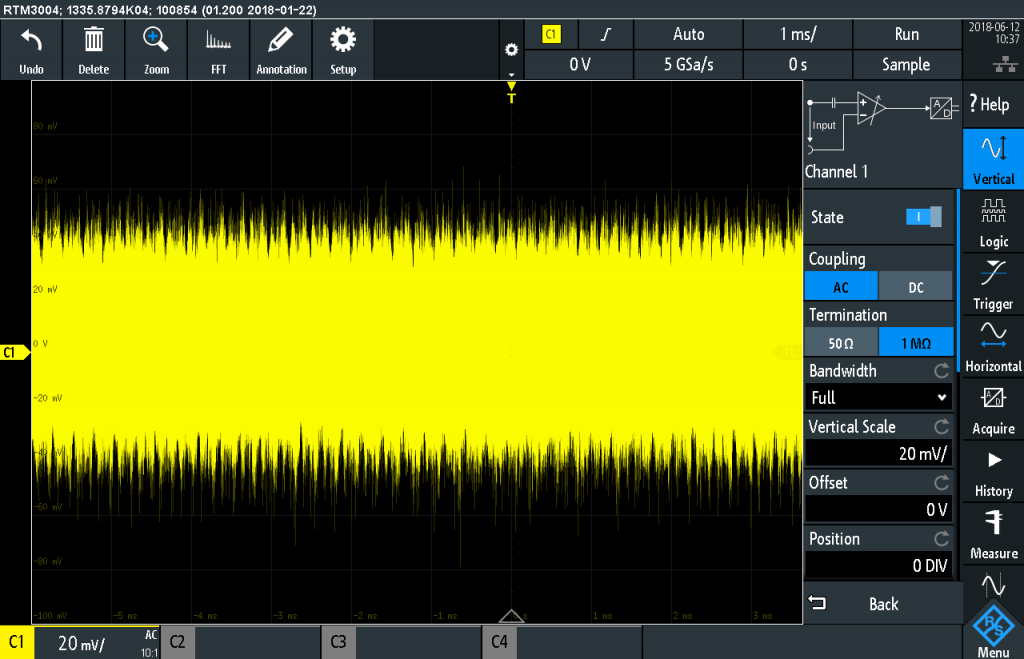
Let’s move on to one of the most popular osciloscope measurements: voltage rails. First, restore your scope’s default setup. Then, move your probe over to the 3.3 volt pin. This point should be the output of the onboard 3.3 volt low drop out (LDO) linear regulator. To see noise on this line, you could decrease the volts/division on the channel to “zoom in” to the DC voltage. However.
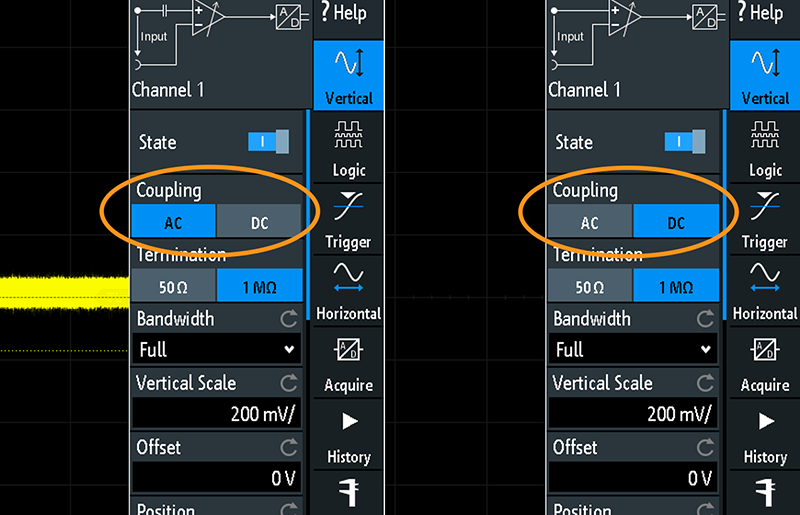
Note, not all scopes support AC coupling. Also, if it does, it may not be available in both 50 ohm and high-impedance termination.
Bonus Tip: Infinite Persistence
Usually, the oscilloscope clears trace data between each acquisition. If your scope supports infinite persistence, you can stop this clearing. Infinite persistence builds up all the waveform data. Heads-up, certain actions clear the screen. Now is a good time to see if changing the volts per division or horizontal scale, or on some particularly poorly programmed scopes, screenshots clear the screen data.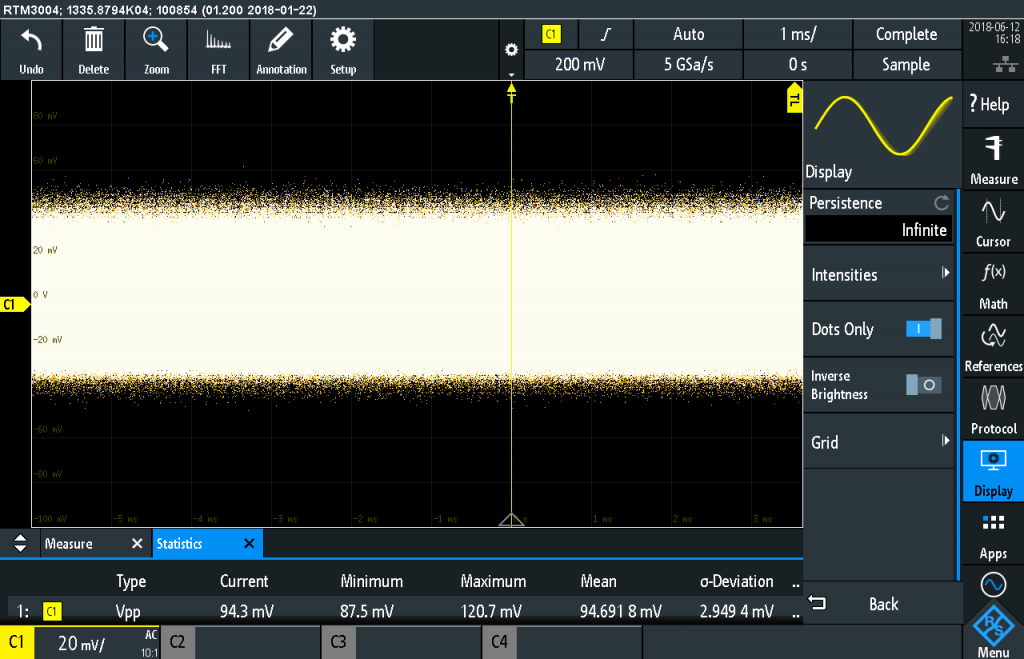
Reader Exercise: USB is clean, right?
Want to see something crazy? Move your probe over to the 5 V pin. USB is not as clean as you think! Is it?#4 See Probe Loading Effects
Previously I talked about different oscilloscope probe types. This oscilloscope measurement demonstrates how you can use two passive probes to see “probe loading” in action. Probe loading means the change a probe causes to the signal under test. For this measurement, you need to locate the ceramic resonator near the ATmega328p.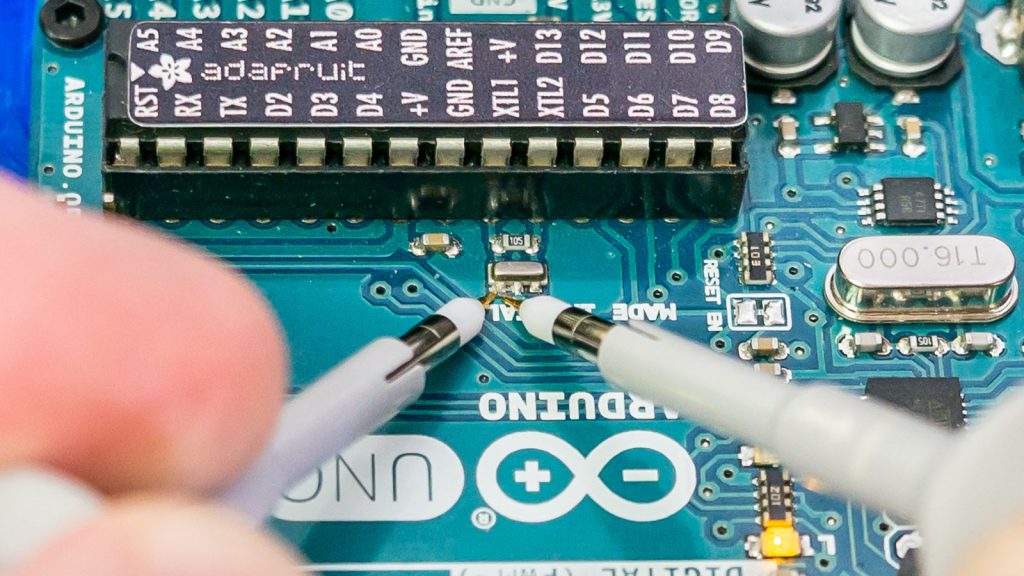
#5 Measure PWM Duty Cycle
Okay, let’s go back to the time domain and make some automated measurements. You might notice in my screenshots, there is only a very faint grid or graticule. In the old days, that grid is how you’d measure a signal.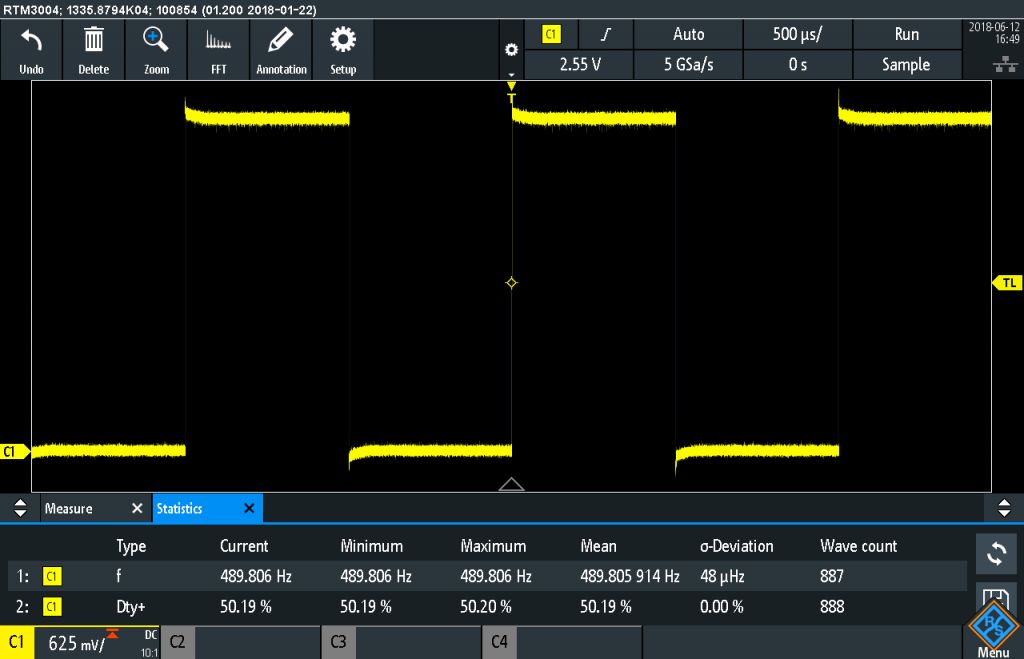
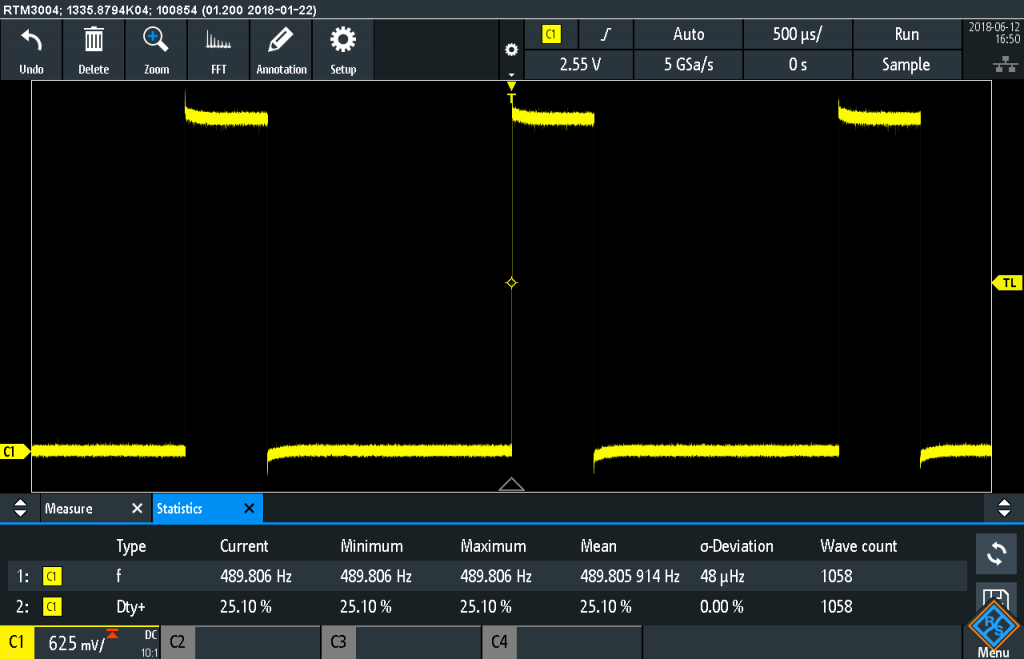
analogWrite(3, 128). Ideally, this means the pin should be on 50% of the time and off 50% of the time. One option is to count the grids. But why? Your scope can measure that time for you. So in the image above, I turned on two measurements: Frequency and +Width. A frequency of about 490 HZ sounds right, as well as, a 50% duty cycle. But, a 50% signal is boring. So I changed the code to 64 instead. Notice how the measurement changed.
Reader Exercise: Loops and Persistence
You could take this a step further, and I suggest you do, to create a loop that increments the PWM value. Try combining it with infinite persistence!#6 Difference between digitalWrite and port manipulation
In the past, I benchmarked digitalWrite() using a logic analyzer. Logic analyzers do not have either the vertical or horizontal resolution of an oscilloscope. They do, however, often support many more channels. Use this measurement to compare the amount of time it takes to turn on two Arduino Uno pins. The first time uses digitalWrite() and the second uses direct port manipulation.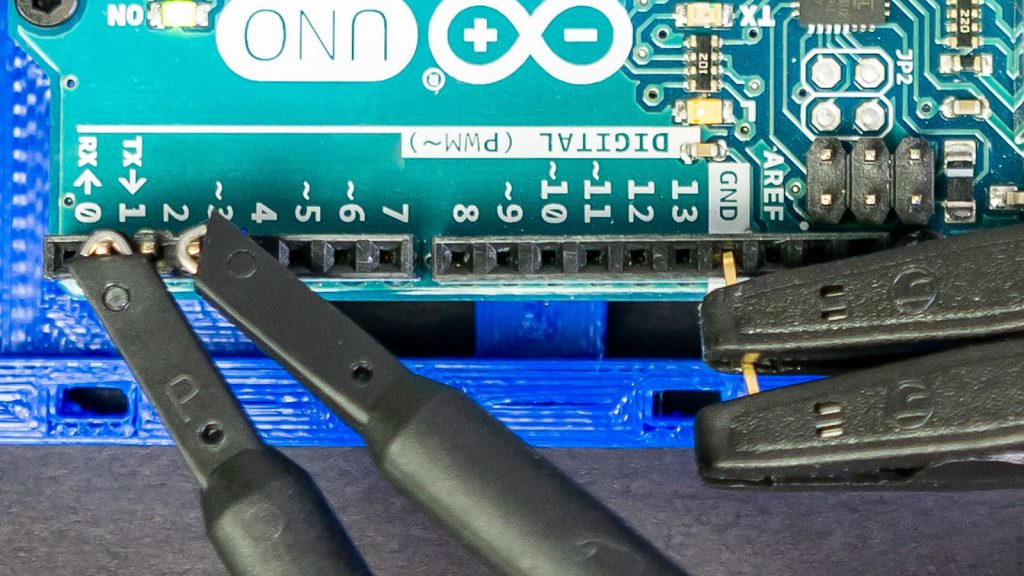
Don’t be alarmed if the oscilloscope screen stops updating. The trigger condition must be met for the screen to update.
digitalWrite Example
First, upload this code using digitalWrite() to turn on the two pins.
void setup() {
  pinMode(1, OUTPUT);
  digitalWrite(1, LOW);
  pinMode(3, OUTPUT);
  digitalWrite(3, LOW);

  delay(1000); //clear delay for auto-restart

  // turn on pin 1
  digitalWrite(1, HIGH);
  // turn on pin 3
  digitalWrite(3, HIGH);
}

void loop() {}
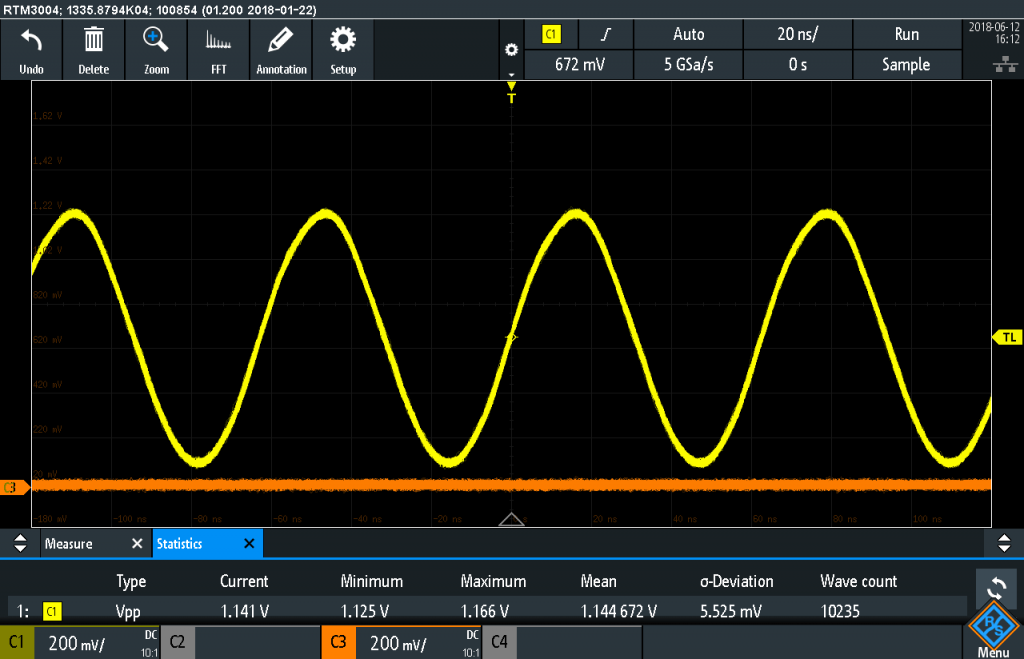
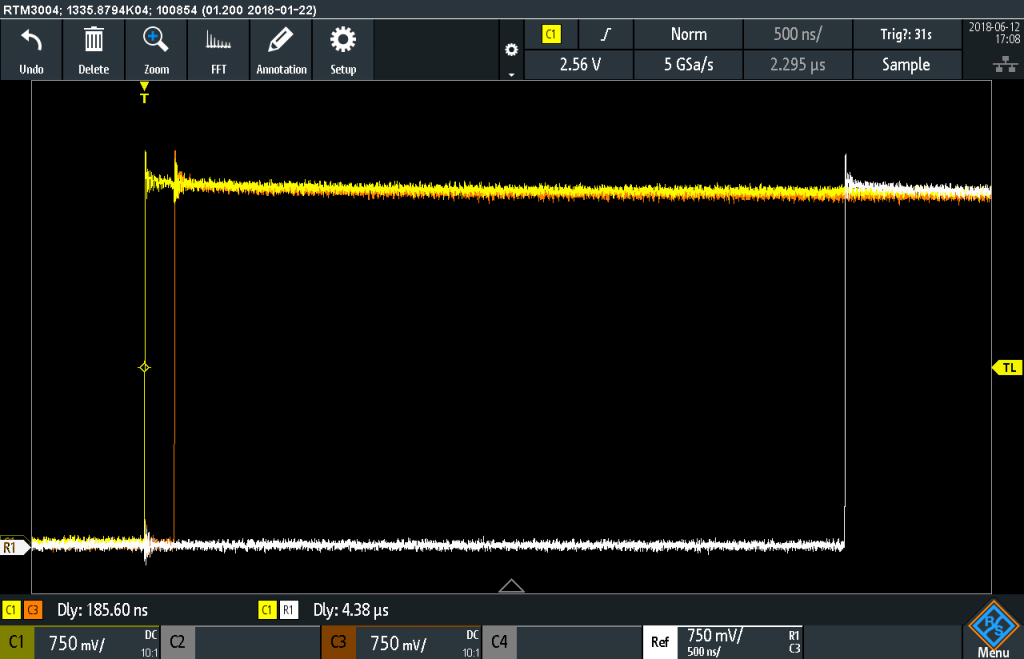
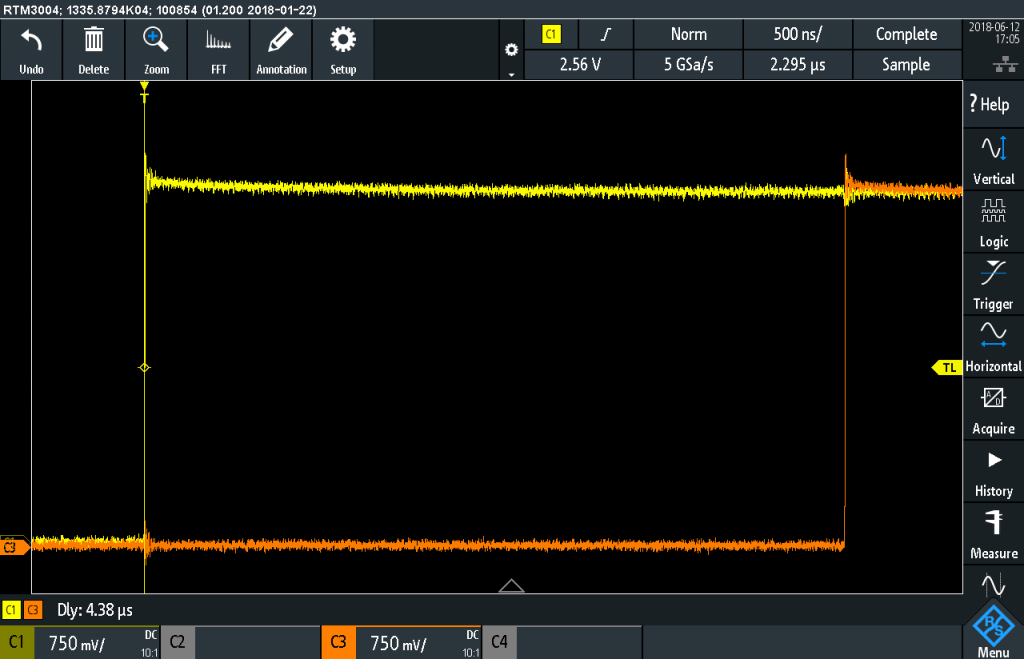 The yellow trace (left) is D1 and the orange trace (right) is D3. The scope triggers on the rising edge of D1 and later captures D3. This oscilloscope measurement shows it takes about 4.3 µs for the Arduino to turn on two pins with the digitalWrite() function.
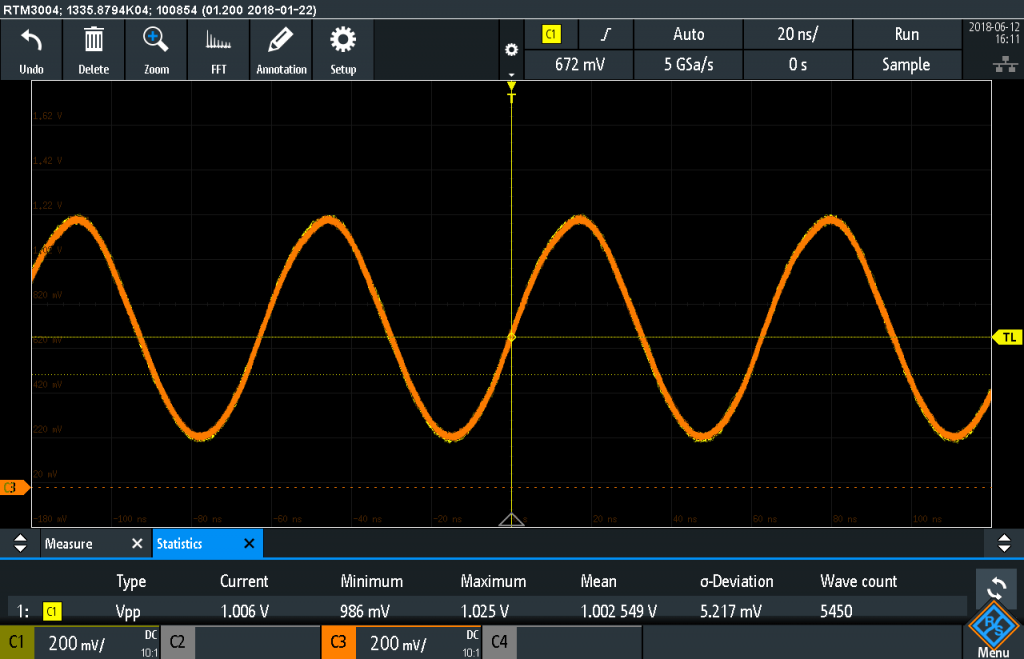
Direct port manipulation Example
Now change the Arduino code to the following:
void setup() {
  pinMode(1, OUTPUT);
  digitalWrite(1, LOW);
  pinMode(3, OUTPUT);
  digitalWrite(3, LOW);
  delay(1000); //clear delay for auto-restart

  // turn on pin 1
  PORTD = PORTD | B00000010;
  // turn on pin 3
  PORTD = PORTD | B00001000;
}

void loop() {}
Reader Exercise: Try replicating my screenshot above.
I used the Reference channel on the RTM3004 to store the first C3 result. Then I set up two delay measurements. One measurement is between C1 and C3, while the other is being C1 and R1. R1 is the “reference” waveform. Scopes treat reference waveforms like physical channels. So you can make measurements on them.Conclusion
Can you believe all of these oscilloscope measurements are possible using ONLY an Arduino Uno board? I find that amazing. How about you? I encourage to understand how to make these measurements with your scope.That said, can you suggest to others simple measurements like these to learn how to use a scope?

11 Comments
Fantastic article, thanks!
I am just curious why you chose 4.5v and not 5v or the RMS value at the auto-reset measuring?
For the 328p’s RESET signal, a HIGH level is anything over 4.5 volts and a LOW signal is anything below 0.5 volts.
Great article!
But there’s little bug… For PIN3 on PORTD you should toggle corresponding bit with
PORTD = PORTD | B00001000;
Now its indeed 130ns instead of 4.41us.
Good catch. Thanks. I updated the code. (Originally I used pin 2, but when writing and taking pictures, decided to use pin 3 so that it would match the channels on the scope. I forgot about the code!)
Great article!
Measuring the time between two signals reminded me of a time when I had to measure how long it took a set of relay’s contacts to close from the time its coill got first energized. I only had an analog scope and I had to use a PC’s parallel port and write an assembly language program to record this”closing time.”
Also, you can find out how coil’s voltage affects closing and opening times. This should be easier with a DSO.
That sounds like a fun experiment.
Maybe change the title to specify digital oscilloscope. Very few of the lessons are reproducible on a good old analog.
Ooooh fantastic article. I would love to see you do something similar exploring other devices using a oscilloscope. This really is a one of a kind piece and invaluable if your trying to learn ‘scope usage at home.
What about something like the popular pinout diagrams for a microcontroller board, but with scope traces surrounding the board instead of pin numbers?
A little more analysis of the serial waveform would be beneficial so that one can send out a letter “A” for example ($41 if I remember correctly), see the start and stop bits, calculate true through-put. I had this as a lab exercise for my students so they could better understand how serial communications really works.
Also, include some I2C waveforms and analysis. Where is the acknowledge signal? (I had to dig for answers…)
I like the calculating bit rate tip. That would be a fun exercise in itself.
Regarding I2C analysis, that is actually the genesis of this post. A couple of years ago, I created a Mixed-Signal demo board. It displays a binary counting pattern on 16 LEDs. There is a button to toggle a fault condition. My next step would be to include some I2C stuff and maybe a RC filter on PWM for analog. I don’t remember now, but I think I broke out I2C and SPI, with the idea of ganging up the boards. I never moved forward on that project.
The other day, I came across the board. I2C has been a big one for me. In the past, I had to learn to read I2C waveforms without any decode. No fun. Then I got to thinking, what could you demo and learn without any additional hardware. What if you only had an Arduino board. Could that be enough to get familiar with a scope? Then I came up with these.