
Everyone’s first piece of test equipment should be a multimeter. Next is probably a power supply with current limiting. For many engineers, the next step is an oscilloscope. At least those working on digital electronics. Even if you are not working with RF, do not overlook a spectrum analyzer. The Rohde & Schwarz FPC1500 is three instruments in one: a Spectrum Analyzer, RF Signal Source, and a Vector Network Analyzer. In this post, I combine an FPC1500 review with an introduction to these frequency domain tools.
tl;dr; I recommend buying the FPC1500.
Update. On September 16th 2018, I joined Rohde & Schwarz North America. This review was written over 6 months before I accepted employment with them. I have fixed grammar and typos, but I have not modified the core content or my sentiment about the FPC1500.
My Early Career
When I was in school, I focused my classes on analog and RF communications. In fact, I was a TA for an analog course. Why? Digital and microcontrollers came very easily to me. So I focused on what did not.
After graduating, I spent a decade working for test and measurement companies. During that time, while I dealt with very high-frequency electronics, it was still considered digital. There were only a handful of times I touched or used a spectrum analyzer, let alone any frequency domain tool.
When I did use a spectrum analyzer, it was always a vector network analyzer used to characterize connectors, cables, and PCB traces.
My spotty experience with tools like a spectrum analyzer gives me a unique insight into the instrument. I can look at it as a new piece of test gear while wondering how I can make use of it. But, it is not a subject utterly foreign to me. That said, since most of my readers are digital-focused, let’s start this FPC1500 review with a basic overview of a spectrum analyzer.
What is a spectrum analyzer
To understand how a spectrum analyzer works, you need to understand a little bit of RF signal theory. Specifically, mixers, intermediate frequencies (IF), and filters. You probably need to understand more, but this gives a starting point.
Remember the good old days, when you would listen to the local morning show on your superheterodyne receiver? If you do not recognize that phrase, maybe the term “FM Radio” is more familiar. (And if you do not know that one, well, it was before Spotify.) Heterodyning is a signal processing technique that shifts a signal from one frequency range into another. Spectrum analyzers use the same technology FM Radios use, though with a bit more precision.

The core component is the RF mixer, which takes two signals in and then outputs two signals on the same output that we call “products.” You get both the sum and difference.
This function is useful in RF electronics. It allows, for example, to take a high-frequency signal from an antenna and “mix it down” to a more reasonable frequency. In the case of a spectrum analyzer, the mixer mixes the signal under test with its signal, called the local oscillator (LO). Those new signals are known as an intermediate frequency (IF). There are filters to pass only the mixer’s products that the analyzer is measuring.
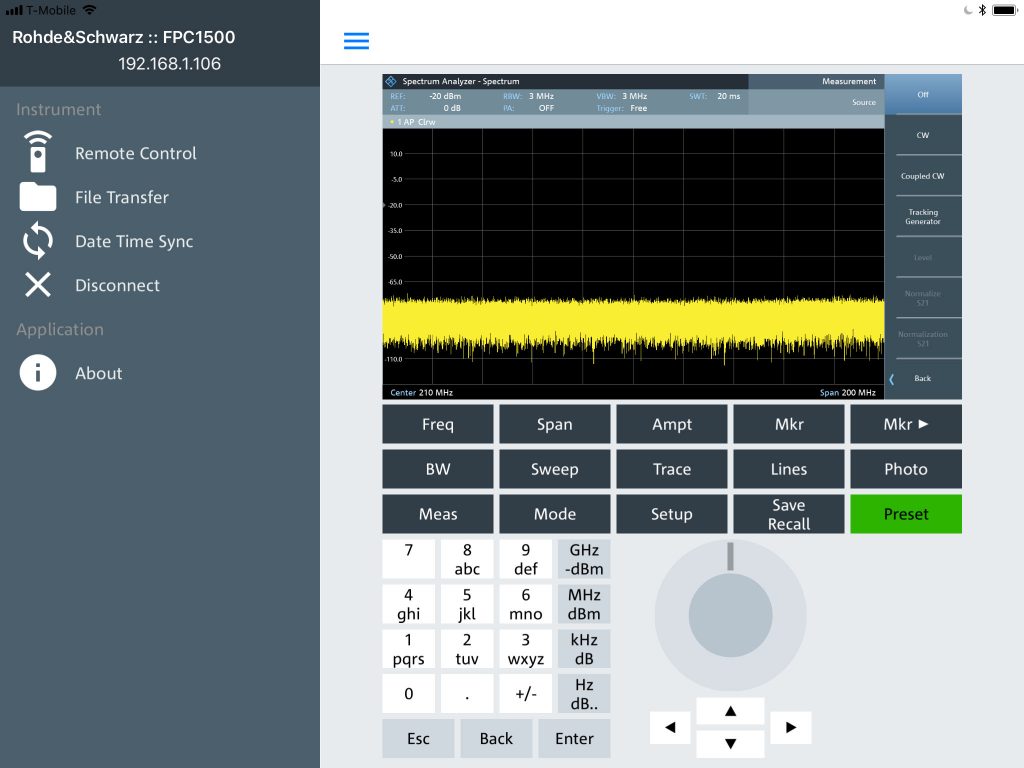
R&S FPC1500 Review
The R&S FPC1500 is not just a spectrum analyzer. In addition to being able to measure RF signals, it is also an RF signal generator. The attractive use for that generator is combining with the spectrum analyzer into an instrument called the Vector Network Analyzer (VNA).
Below I talk about each of these instruments or features–since it is one low-cost box.
Spectrum Analyzer
The FPC1500 is based on the R&S FPC1000, which is only a spectrum analyzer. That is a good thing; the FPC1000 is a great analyzer.
The base model offers a 5 kHz to 1 GHz frequency range. Option keys enable upper-frequency limits of 2 GHz and 3 GHz. At the end of the post, I address the unit’s upgradability a bit more.
Beyond frequency range, there are two other spectrum analyzer “banner specifications” to consider: RBW and DANL.
RBW
A lowpass filter after the RF mixer defines the measurement’s resolution bandwidth (RBW). A wider RBW allows for a faster sweep speed, updating the screen faster. However, you get less overall resolution from the displayed sweep. The FPC1500’s RBW ranges from 1 Hz to 3 MHz.
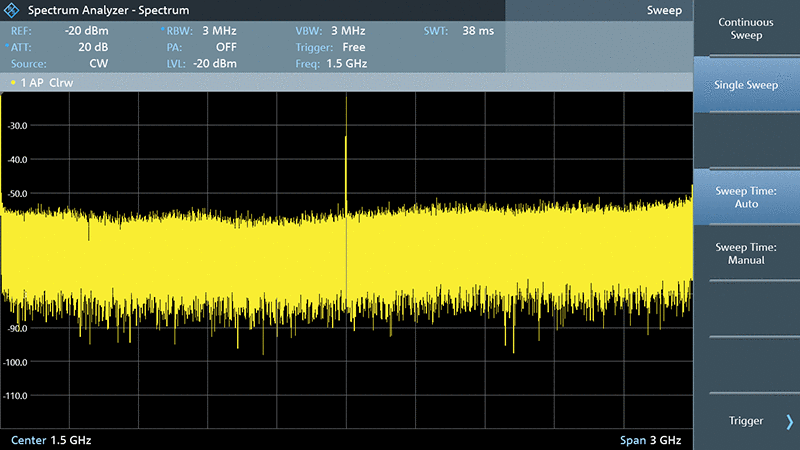
Here is an example where the RBW can matter. At a 3 MHz resolution bandwidth, the analyzer sweeps the entire range in 38 ms. There is a significant spike at 1.5 GHz. The rest of the screen is just noise and uninteresting signal.
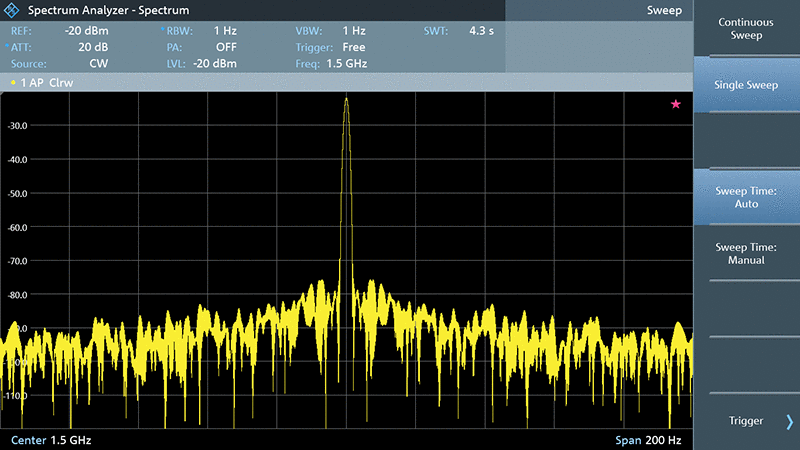
Now I have captured the same single with a much higher resolution. The downside is that it takes 4.3 seconds for the analyzer to sweep. In a real measurement, the next step might be to change the start and stop frequency closer to the signal of interest.
RBW, Sweep Time, Span
These three features are related. The last time I used a spectrum analyzer you had to fiddle with all these parameters to get a decent trace. Today, it is nice that the “auto” functions of the analyzer work so well. In general, I found I could set the center frequency and the span. I would leave sweep time and RBW up to the instrument. Changing the span is a more automated way to change the start and stop frequency. How these are related will be the subject of a future post.
When I look at other spectrum analyzers in this bandwidth class, I do not see any with this kind of range. The FPC1500 excels at both the low and high end. It is not often you get the advantages of both better and faster in the same instrument.
DANL
As with all test equipment, there is some noise in addition to your signal. For spectrum analyzers, this is called the Displayed Average Noise Level, or DANL. It seems standard to compare analyzers’ DANL as their baseline merit.
Here, I need to rely entirely on datasheets. I do not have the experience or equipment to make proper comparisons in my lab.
When I look at the R&S FPC1500 compared to the Rigol DSA815, I see these specs.
Test equipment companies always make direct comparisons difficult. The ranges do not match up exactly. So, the key here is that the FPC1500 has a lower DANL than any analyzer I look at in its frequency range. That said if you have suggestions on how to measure DANL and a similar analyzer from another company, leave a comment. Maybe we can make a virtual comparison.
Spectrum Analyzer
Without question, the spectrum analyzer function of the FPC1500 is fantastic. Plenty of features and functionality for its price class. I think being built on the same foundation as the FPC1000 and coming from R&S sets it apart from its competitors.
Demodulation for AM/FM/ASK/FSK is available with software option FPC-K42. A vaguely named “advanced measurement” option, FPC-K55, adds a spectrogram, channel power, third-order intercept (TOI), harmonic distortion, TDMA power, and AM modulation depth. FPC-K43 adds channel scanning and EMI pre-compliance. EMI compliance is a subject I will be covering more in the future.
This FPC1500 review does not cover those features. For more information on just the spectrum analyzer, I would recommend checking out the FPC1000 element14 Road Test Reviews. The reviews posted there go in-depth into the FPC1000, and by extension, the FPC1500.
The focus of this FCP1500 review is what sets it apart from the 1000.
Signal Generator
In the RBW example, I showed the same signal measured at different resolution bandwidths. However, what did I use as the signal source? In my lab, I have four things that can generate signals.
- My arbitrary waveform generator,
- Generator built into my RTM3004 Oscilloscope,
- A 4GHz frequency synth I bought on the Tindie Marketplace,
- and the FPC1500!
In this case, since this is an FPC1500 review, I used its built-in CW tone. It operates from 5 kHz up to the enabled frequency limit with a power output range from -30 to 0 dBm.
Generator’s 3 Modes
The signal generator can operate in three modes:
- Independent (CW). The user controls frequency and power individually. The spectrum analyzer settings do not affect the generator.
- Coupled (CW). The user controls the power level, while the spectrum analyzer’s center frequency controls the generator’s output frequency.
- Tracking Generator (TG.) The user controls the power level, while the spectrum analyzer’s sweep frequency controls the generator’s frequency.
Modes #2 and #3 are useful for seeing how a device under test reacts or changes a signal. For example, you can see the response of a filter. You would probably use the Tracking Generator most followed by independent output.
An issue I have with the generator is that the output is not what I expected. When I think “RF Source” and “CW Output”, CW means “continuous wave.” I think of a sine wave. However, the output of the FPC1500 is more like a square wave. It is better described as a “CW Tone.” In terms of being used as a tracking generator, this waveshape does not pose an issue. The additional harmonics caused by the wide bandwidth signal are filtered out by the IF filters. As an independent output, you have to consider if a square wave works in your application.
While looking at the raw response on-screen is useful, it can be limiting. The VNA software option enables measurements that make use of having a source and receiver in the same box.
Vector Network Analyzer
A vector network analyzer, or VNA, is easily one of the most misunderstood instruments in an electronics lab. In my career, most labs I visited there was usually only a single person who understood it. The box was big, it was loud, and it had all kinds of weird-looking connectors. By adding the generator to the FPC1500, R&S enables this instrument to work as an entry-level Vector Network Analyzer, and it is not nearly as intimidating as a standalone analyzer.
VNA Simplified
A vector network analyzer sends out a signal and measures what it receives. The signal sweeps across a range, plotting the results along the way.
S-Parameters, also known as scattering parameters, is a method to describe an RF network. In the case of the FPC1500, there is a single source and a single receiver. This combination results in a “one-port VNA.” (Now if we could generate a signal and receive in the opposite direction we could create a two-port measurement.)
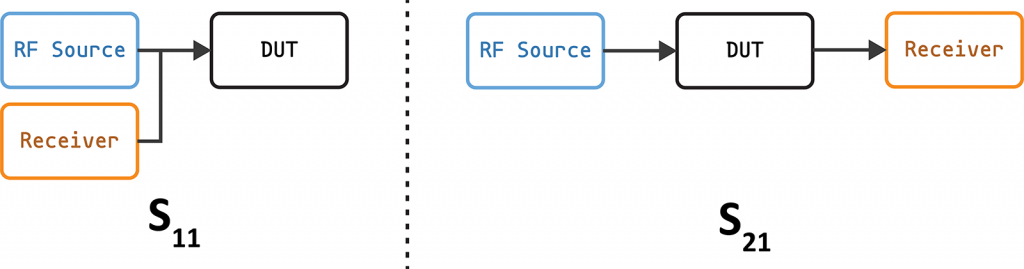
Typically in this price range, you might need to buy an external VSWR bridge to make this one-port VNA measurement. The FPC1500 has the bridge built-in. With the built-in bridge, it is possible to measure two ratios:
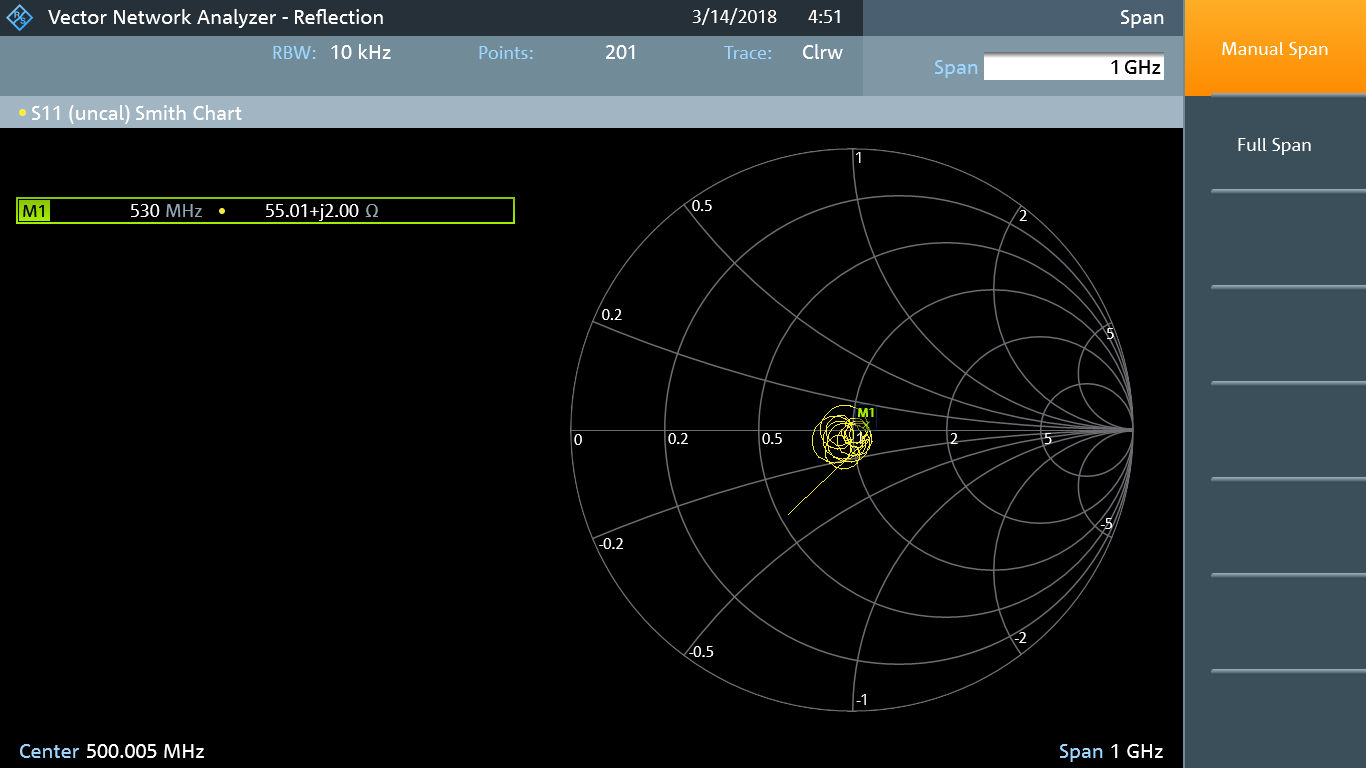
1. Return Loss (S11). Any impedance mismatch in the connected device will cause a reflection. Return loss, or S11, is the most common antenna rating. At a given frequency, a 0dB return loss means 100% of the energy is reflected. Which means at that frequency, the antenna is useless. Below I will show how to characterize an antenna and measure cable length with S11.
2. Insertion Loss (S21). The ratio of the signal power delivered to the signal power received. For a passive device like a filter or cable, the number will be positive. The device under test will always have some losses. If gain occurs with an amplifier, then S21 becomes insertion gain, and the number becomes negative.
Here are three example measurements you can make with the VNA Software option FPC-K42.
Characterize Antenna
Using an S11, or reflection, measurement the FPC1500 plots an antenna’s frequency response. This measurement shows which frequencies the antenna is best suited to transmit (or receive.) In the screenshot below I have attached a GSM antenna to the analyzer. The datasheet for the antenna says it is suitable for 850/900/1800/1900/2100 MHz. Looking at markers 1, 2, and 3, you can see the antenna responds best around 830/1938/2155 MHz. Dips below -10dB indicate frequencies that the antenna radiates best. I would say this measurement agrees with the datasheet.
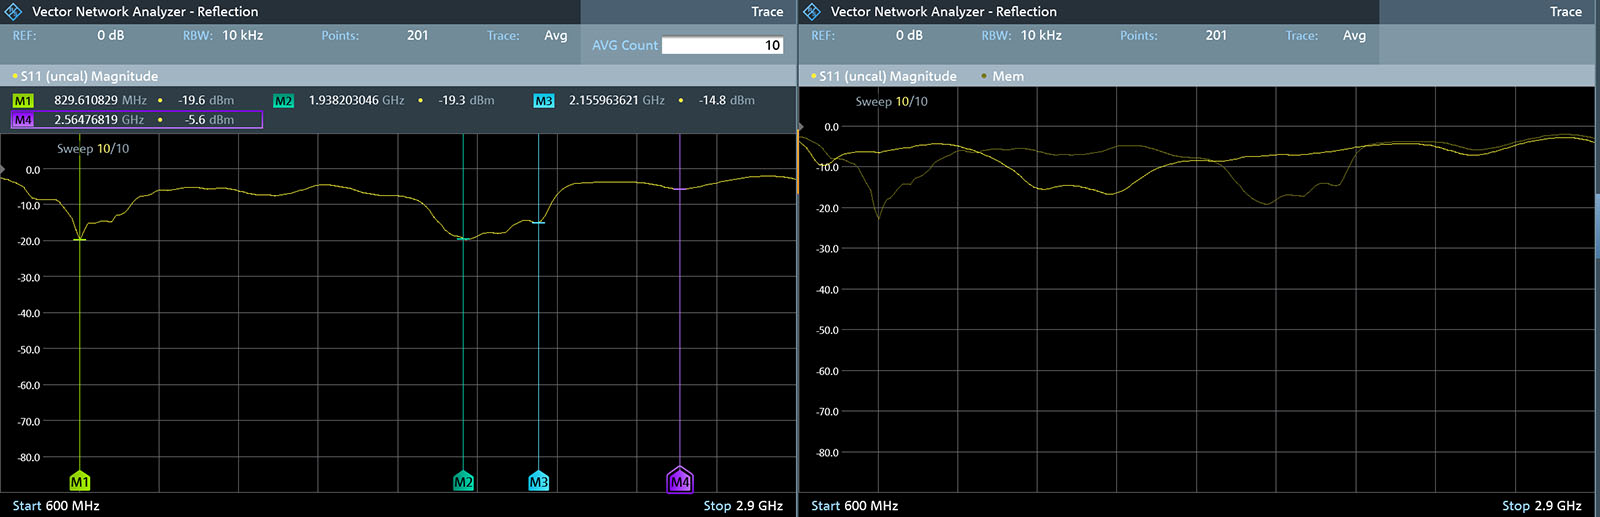
For fun, I wanted to demonstrate the challenges cell phone manufacturers have with their antenna designs. On the right side of the image above, I put my hand on the antenna. The brighter yellow trace is the current trace, while the dimmer yellow trace is the same as the left. I found it interesting how around 1.3 GHz the antenna went from almost useless to very useful. Think about that change the next time you grip on your phone.
Distance-to-fault
Another S11 application is measuring a damaged cable. The distance-to-fault measurement is self-explanatory. The analyzer determines in meters, or feet, how far down a cable a problem exists. For example, you might have a kink, a loose connector, or another issue. I have seen this measurement used in antenna installations to verify there are no issues from the antenna to the transmitter. To use this measurement, you do need to tell the analyzer the type of cable. There are some typical presets built-in.
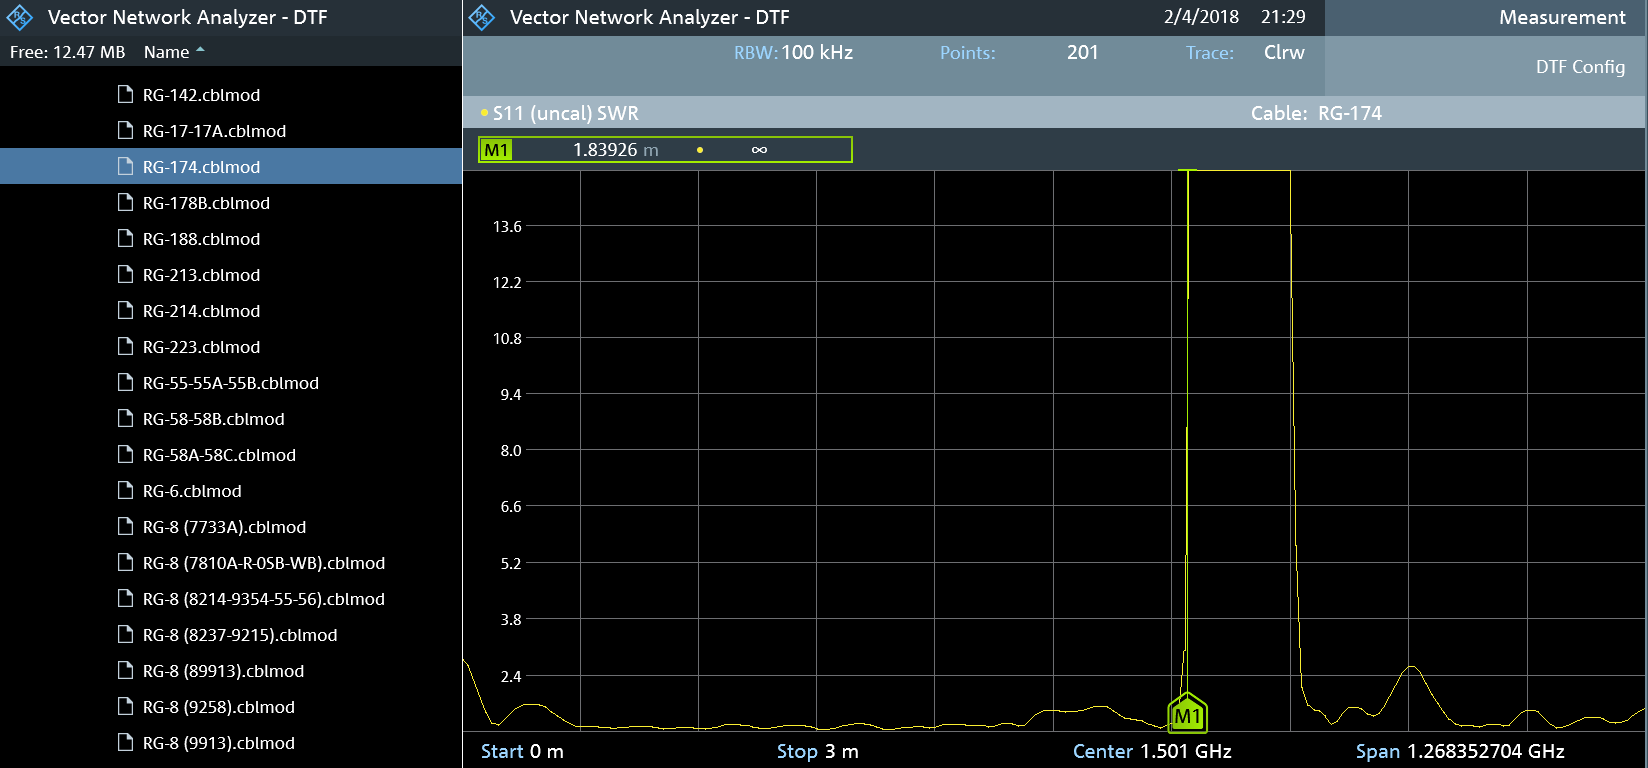
The screenshot above shows the DTF measurement with an SMA cable. There is a sharp change in the standing-wave-reflection (SWR) at 1.839 meters. The cable is a 6-foot RG-174 SMA cable with nothing connected. In this case, we measure the length, and it is correct. One thing I do not like about the DTF measurement is that the screen does not show the resolution or increment of each point. In the DTF Overview Screen, you do get that additional information. But that means opening another menu. In this case, each point represented was 118 mm.
Characterizing a Cable
In both the antenna and cable length example, we measure the energy reflected back into the analyzer. The 1-port cable loss measurement is similar. In that measurement, only one end of the cable is connected to the analyzer. The analyzer uses the reflected signal to determine loss at various frequencies. There is an option to attach a short to the cable’s other end which improves the measurement.
A more accurate method is an S21 insertion loss, or transmission, measurement. S21 compares the power output to the power input. Since the analyzer is directly connected to the cable, It can more accurately measure the loss through the cable across frequency.
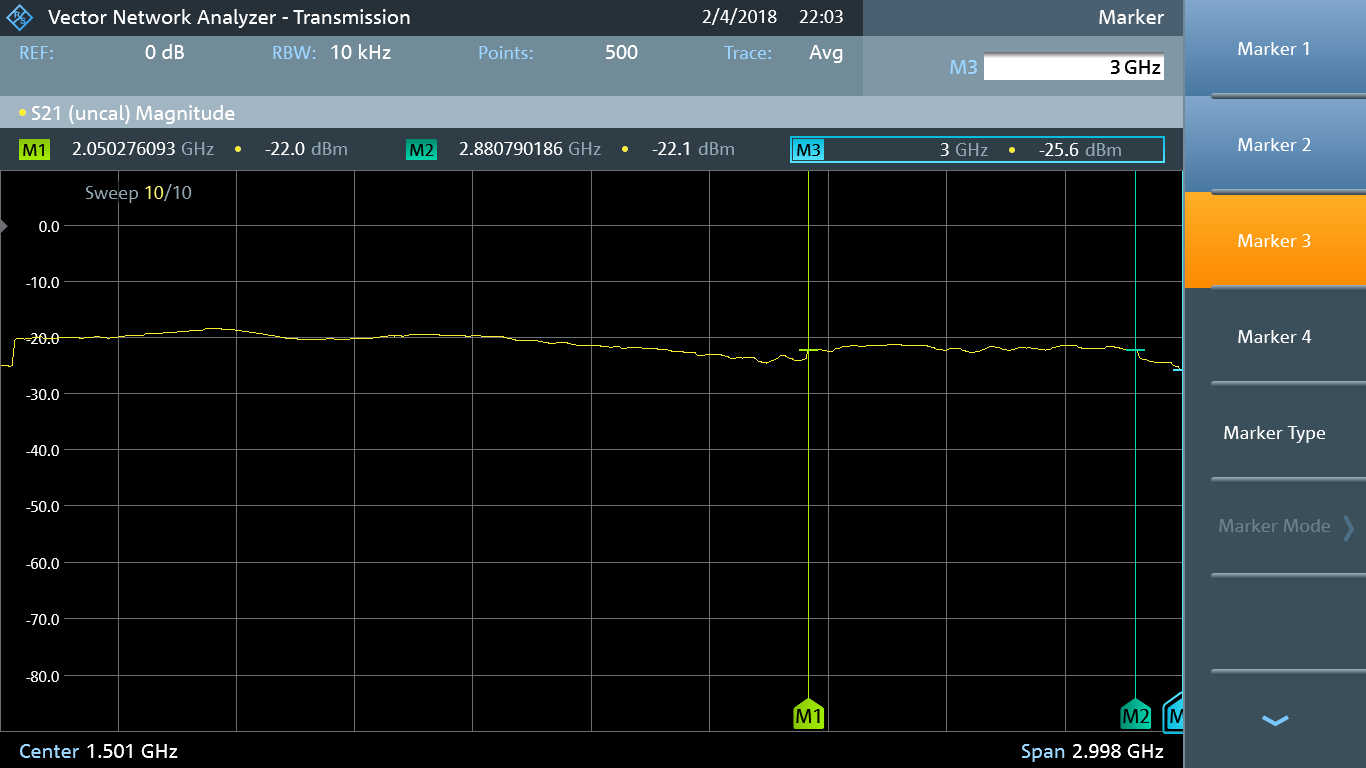
The cable measured in the shot above is a cheap 12-inch SMA cable from eBay. I am astonished by its performance. It is nearly flat up to 3 GHz. There is some dip around 2 GHz, and it starts falling off at 2.8 GHz, but overall, wow. Not shabby for a five-dollar cable.
There are other measurements possible. But for this FCP1500 review, I wanted to cover at least those three. In the future, I plan to show a DIY fixture that lets you measure passive components with the VNA software. (Assuming I get it to work!)
Upgradeable Features
Software-enabled or upgradeable hardware features are standard in high-end test equipment. The same practice is becoming popular on affordable and mid-range instruments. The idea is that you purchase what you can afford today and upgrade later.
These are the upgradable features I made the most during my FPC1500 review. There are other options available. Please double-check the FPC datasheet to verify which options include specific features, before making a purchase.
- Frequency Range. 2 GHz and 3 GHz options are available. These affect both the analyzer and signal generator.
- Preamplifier. An RF amplifier is useful when using external probes or very small signals. There is no external probe power port, so consider this when deciding between the built-in or an external amplifier.
- Wi-Fi. The instrument comes with a LAN port, which I assume is enabled by default. WiFi is an additional option. Though, note, I did run into a common issue others saw on the older FPC1000. The instrument does NOT remember your WiFi password. So it must be re-typed each time you power-on the analyzer.
- VNA Software. This feature adds Smith charts, S11, S21, and VSWR measurements. You can operate the tracking generator without VNA mode, but not enable the built-in VSWR bridge or associated measurements.
If you are looking to buy your first spectrum analyzer, give the FPC1500 a serious consideration. If you do not have the budget for 3 GHz and the VNA software, add them later.
FPC1000 vs. FPC1500
A question I am sure many will ask: should I get the FPC1000 or FPC1500? Remember, the spectrum analyzer is the same. However, the FPC1000 does not have the hardware built-in for the signal source. If you know for sure you will never make use of the built-in source; the FPC1000 is a lower cost option. For me, if I were deciding today between the two, I would pick the FPC1500 even if I only wanted an analyzer. The ability to turn on the VNA measurement features later-on down the road is enticing. I would rather have the option than not.
Usability
Lastly, I want to touch on the usability of the instrument. R&S goes out of their way to mention that the FPC1500 is designed in Germany. Even though I have only used high-end R&S in the past, this low-cost instrument is definitely from Rohde & Schwarz.
Buttons
The front panel is relatively basic but functional. The buttons feel satisfying to press. The twist knob is a bit more sensitive or looser than I like, but I got used to it. It also seemed like sometimes I would turn the knob but the on-screen menu indicator would go the “wrong” way. Not a deal-breaker, just a usability quirk. (And what test equipment is not without them?)
Regarding weight, the FPC box is a very light. It almost feels empty. I have noticed other users complain about the lightness when using the buttons. Pressing buttons can move the entire analyzer back. This movement was not an issue for me. I guess it is because I tend to put my hand on top of the instrument while using my thumb to press a button. Others seem to use their pointer finger to poke at the control panel.
I could never figure out what the cursor buttons do. Maybe they are an alternative to the knob, but while writing up this review I realized, I never once touched them. (Not a bad thing, just a curiosity.)
User Interface
It took me a few hours to master the user interface. Remember my approach here is that I have not used a spectrum analyzer regularly for almost two decades. There were two learning curves I had to get over:
- How do spectrum (and vector network) analyzers work?
- How does the R&S FPC1500 work?
To be frank, I think the UI/UX is a little bit clunky. With touchscreens becoming standard on test equipment, the UI is begging for touch. The most prominent mistake I kept making was trying to change the center frequency when I did not have the Frequency menu enabled.
As I said, after a few hours of use, I was able to navigate the instrument fine. Now that I have a better idea where the VNA functions and source controls are located, I can navigate quickly. Though I still occasionally type in a frequency even though I am on an unrelated menu. On that quirk, I am starting to suspect the problem is not the analyzer. 😉
Remote Operation
R&S offers two forms of remote connectivity. You can download their InstrumentView software or a mobile app. The mobile applications support both Android and iOS.
On an instrument in this class, I will put remote operations on the “nice to have” list. Both the PC and iOS applications work well. I had no navigation or connectivity issues. There is a “file transfer” option, which I thought could be used to transfer screenshots. I could not figure out how to do that, so maybe not. Outside of moving screenshots across, I could not think of how I would use this feature for this instrument. Regardless, I would rather have the option than not.
USB Ports
There are two USB ports on the front. Keyboards do not work, which is disappointing when entering the WiFi password. So then why two? One for a flash drive and the other is for calibration fixtures. (I do not have a calibration fixture to test, however.)
Noise (Audible Noise)
This section is the easiest to write. This box is silent. No fan. No relay clicks. It is amazingly quiet. I leave it running overnight because there is no audible reminder it is on. I love it.
Conclusion
At the end of this FPC1500 review, I asked myself: would I buy it? Yes, yes I would.
The basic FPC1500 is $2970 for the 1 GHz unit. Upgrading to the full 3 GHz takes the price up to $5030. WiFi support is over $300, so I would probably pass on that feature. However, I would strongly consider the preamplifier which runs $430. You might be able to get an external unit for less, but I would rather have it built into the analyzer.
Long story short, if I were buying the instrument, I would consider a configuration that runs $6380. That includes $920 for the VNA measurements. (S11, S21, Cable Loss, DTF, and Smith Chart.) If your budget is tight, consider turning on the VNA later.
If you are not used to RF or high-frequency, or just everyday frequency-domain instruments, this price could sound high. On the other hand, a 3 GHz Spectrum Analyzer and Tracking Generator for less than $6500 from the best spectrum analyzer company in the world, is pretty amazing. This RF suite will carry you for a long time to come.
Bald Engineer Recommendation: Buy it.
Learn more about the FPC1500
7 Comments
The datasheet states that only S11 measurement is supported on the VNA. Intrigued as to how you got an S21 measurement?
I’m not sure which datasheet you’re looking at then. Page 10 of the current datasheet shows the VNA option supports S11 and S21. Page 11 has the details on S21.
https://scdn.rohde-schwarz.com/ur/pws/dl_downloads/dl_common_library/dl_brochures_and_datasheets/pdf_1/FPC_dat-sw_en_5214-7112-22_v0500.pdf
Additionally, the screenshots came from my personal FPC1500. I’ve used several other FPC1500s as well. They all support both S11 and S21. So the datasheet shows it supports the measurement and it is in the firmware. I am not certain where you got the idea it does not exist.
Thanks you! How weird, I have an R&S brochure/datasheet that just says S11 in front of me!
To quote:
“One-port vector network analyzer (S11)”
But looking at the picture below ithis comment it does show the S21 screen!
Am now hovering over the order button 🙂
Thanks again.
I highly recommend it, especially with the current promotion R&S is running. All the options for something like $5k.
In disclosure, I started working for R&S about 6 months after that review was posted.
But even if I didn’t work for them, I’d still recommend the FPC1500.
Well, as I interpret the datasheet, S21 is not a real “vector” measurement, since it only measures magnitude (no phase). Full VNA measurement is possible as S11 only. S21 is seems to be a “SNA” measurement. So, strictly speaking, “One-port vector network analyzer (S11)” is correct.
In the late ’70’s (retired 16 yrs now) I was amazed by the measurement capability of a spectrum analyzer made by Singer. I was able to put an analogue multiplexed 1200 voice channel baseband into the analyzer and tune in a single telex channel carrier and determine whether it was on frequency within 3 cycles. I could call the sending terminal (several hundred miles away) and advise them for no other reason but to brag about the spectrum analyzer’s specs.
Like it!